Business Analytics
Utilize our advanced business analytics and reporting tools to gain comprehensive insights into your data, allowing you to understand trends and patterns crucial for decision-making. With these tools, you can analyze various metrics and performance indicators to make informed strategic choices that drive business growth. Our user-friendly interface makes it easy for users of all levels to navigate and derive valuable insights from the data.

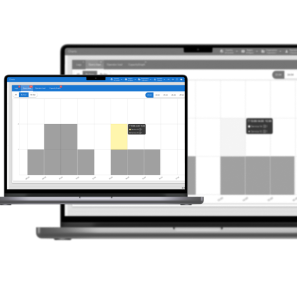
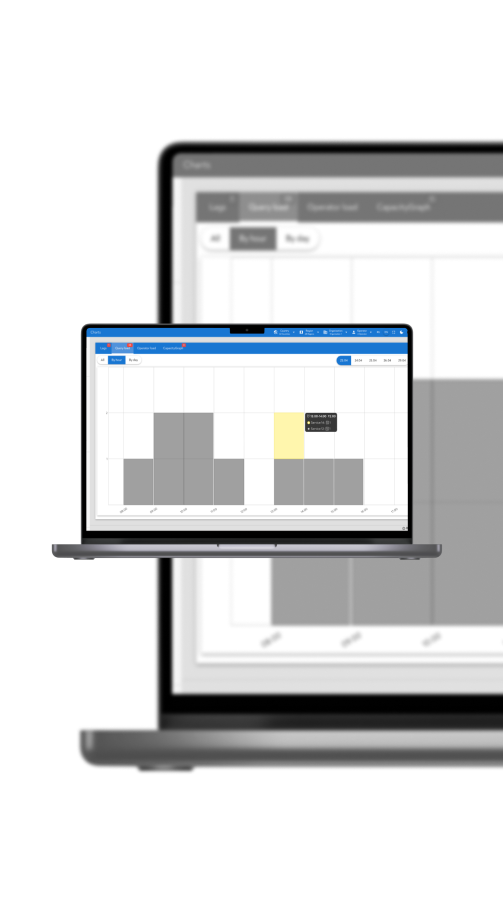
Graphs of the dynamics of the Electronic Queue
These analytical tools are key to managing the quality of service and planning the work of the Organization. They provide managers with valuable data to make informed decisions and improve the service.
-
1
Queue Delay
This graph shows the current and forecasted queue delay, allowing you to analyze the waiting time of Customers in the queue. It is an important tool for identifying problems in planning and managing the flow of visitors.
-
2
Queue Load
Demonstrates the Organization's current and projected workload. Using this graph, you can see how the flow of Customers is distributed throughout the day and what are the peak hours. This helps in optimizing the distribution of working resources and optimizing the schedule of Operators.
-
3
Operators Load
Demonstrates the planned employment of the Operator's working time, contributing to the analysis of the evenness of the distribution of the load among the personnel. This allows you to identify Operators from with an excessive amount of work or with free time, providing an opportunity to optimize work schedules, quotas and services of the Organization.
-
4
Productivity
The graph shows how many people were using different services at the same time. Each bar represents a different service, and the taller the bar, the more people were using that service simultaneously.

Administrative Reports
Reports are crucial in this system as they provide insights into service usage patterns, helping to make informed decisions regarding resource allocation and service improvement strategies.
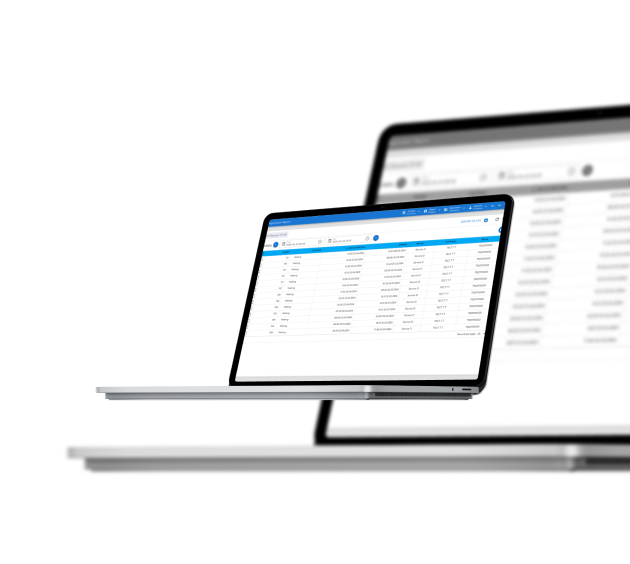
Report on tickets of the electronic queue system
This report is a valuable resource for System Administrators as it allows you to monitor service performance and quickly identify bottlenecks in the queue process. This approach helps to optimize the allocation of resources and improve the quality of customer service.
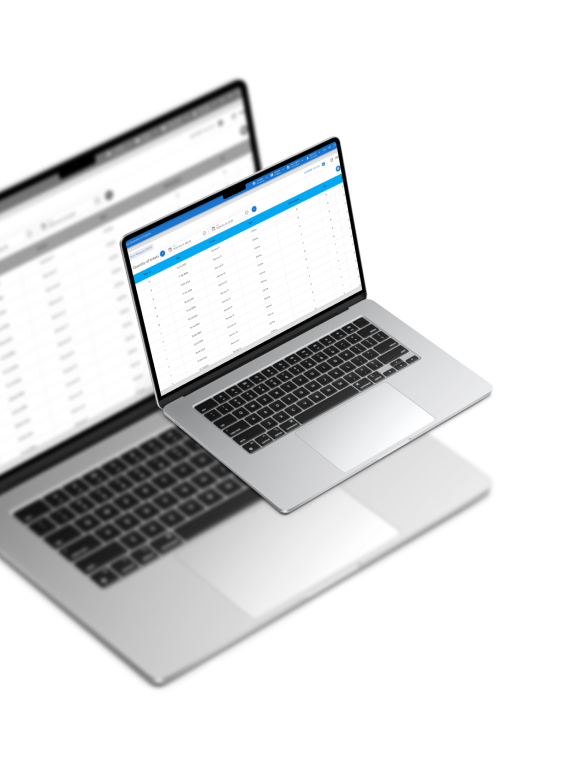
Report on the number of tickets
Such a report is an important tool for administrators and service managers because it helps track workload, process efficiency service and customer satisfaction. The data obtained from this report can be used to optimize the planning and allocation of resources, as well as to improve the quality of services.
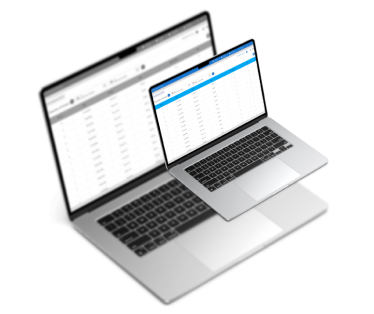
Report on the efficiency of operators of the electronic queue system
This report helps system administrators identify the most and least efficient operators, analyze work processes, and make informed decisions to optimize work hours and improve overall staff productivity.
